
Cost Reduction by Managing Customer Relationships.
When price pressure increases, improving the economics of existing customer relationships can reduce cost while preserving value.
Companies facing margin pressure frequently concentrate on purchasing, production efficiency and headcount. Customer profitability adds another perspective because two customers buying the same value of goods can have very different effects on profit. Product mix, delivery requirements, order frequency, technical support, commercial terms and working capital can all change the economics of the relationship.
Conventional financial reporting often leaves much of this hidden. Sales and product margins may be visible, while customer-related costs remain spread across sales, warehousing, transport, administration, technical support and finance. Bringing these together produces a characteristic pattern. A relatively small group of customers may generate most of the profit, another group sits around break-even, and a tail of customers progressively consumes part of the profit created by the stronger relationships.
This produces the familiar customer profit cliff. The curve identifies where profit is being created and where it is being consumed. Management then has to understand the causes behind each customer’s position on that curve before deciding what action makes economic sense.

Different customers create very different economics
One manufacturer of consumer equipment, producing mainly fabricated metal products together with some electrical components, showed the pattern particularly clearly. Profitable customers together generated around US$200,000 of contribution, while the customers at the loss-making end of the curve consumed more than twice that amount. Two large customers accounted for almost two-thirds of the losses generated by the unprofitable group.
Their sales volumes gave them commercial importance, yet the economics of serving them were weak. Some large export customers bought a relatively unattractive product mix, required expensive transport and export administration and took longer to pay. The margin generated by the products therefore had to support a much heavier customer-service burden than management could see from sales values alone.
This gave management several possible ways to improve the relationships. Product mix could be changed, pricing and freight arrangements reconsidered, service requirements reviewed and payment terms tightened. Customer profitability had identified the relationships consuming profit; the underlying causes determined what management could do about them.
That distinction becomes important when companies respond to profitability analysis too quickly. Some weak customers can be repaired economically, while others remain unattractive after every practical commercial change has been considered.
Improving the relationship can preserve the customer
A mid-market clothing manufacturer selling mainly into Western Europe provides a good example. The company remained profitable, although increasing price competition was beginning to narrow margins. Customer analysis produced the same profit-cliff pattern, with strong customers at one end and progressively weaker relationships further down the curve.
The costs associated with weaker customers led management into several parts of the business.
Inventory was one of them. Suppliers began delivering materials closer to the point at which production required them, while manufacturing batches were completed faster so finished goods spent less time waiting in storage. Stock levels fell and warehouse space became available. Management subsequently rented the released space to third parties, turning an operational improvement into an identifiable cash benefit.
Commercial concessions produced another opportunity. Costs originally grouped within management activities included a significant amount of customer rebates and volume discounts. Detailed review of the underlying contracts showed that some customers were receiving overlapping benefits under different arrangements, with economically similar concessions being paid twice in different forms.
Management rationalised the agreements and renegotiated the commercial terms. Discount and rebate costs fell by around 50%, while sales volumes were maintained.
The profitability improvement came from understanding the cost created by the relationship and changing the way the business operated around it. Revenue remained with the company while inventory, warehousing and commercial costs were reduced.
This is an important feature of customer-profitability analysis. A weak result on the profit cliff may lead to price changes, revised delivery arrangements, different payment terms, new service levels or changes in the way stock is managed. Customer exit becomes one possible outcome among several.
Profitability can change when the economic boundary changes
A diversified wholesale and retail group presented a more complicated case. The wholesale and retail businesses operated under separate management, and the retail operation appeared unattractive when viewed from the supplying company’s customer-profitability analysis.
The group chief executive had deliberately established a subsidised transfer price to support expansion of the retail business. Retail was being developed as part of a broader group strategy and also provided substantial purchasing volume for the wholesale company. That extra volume allowed the group to buy larger quantities from suppliers and obtain better prices.
The two operations also shared purchasing, warehousing and other infrastructure. A substantial reduction in retail volume would therefore have affected the economics of wholesale as well. Purchasing volumes would have declined, supplier terms could have weakened and part of the shared cost base would have remained inside the group.
The customer-profitability result was valid at the level at which it had been calculated. The wider group economics added information that management needed before taking action.
This case illustrates the importance of defining the correct economic boundary. A customer relationship can consume profit in one entity while contributing purchasing scale, infrastructure utilisation or strategic growth elsewhere in the same group. Decisions taken at divisional level can therefore produce a weaker result for the organisation as a whole.
When the route to market consumes the margin
An international beverage company produced the most extreme example.
The company was building a national market and losing approximately US$1 million each month. Management initially expected manufacturing efficiency to provide a large part of the answer. An early review of the factory showed production operating at the international group’s world-class standards, and the analysis moved downstream into customer and channel economics.
The company had built its market around rapid national delivery to approximately 20,000 customers, with a standard service level of one-day replenishment across the country. Supporting that promise required a three-tier distribution system involving central, regional and local warehousing, delivery vehicles, secondary transport and a substantial sales organisation.
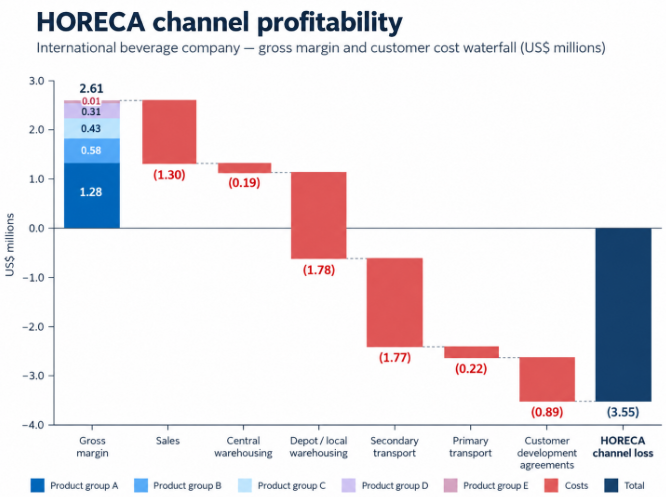
The product margin looked attractive until the full cost of getting the product to the customer was included. Warehousing, depot operations, primary and secondary transport, sales and customer development expenditure consumed large amounts of the margin generated by individual channels. In some parts of the market, those customer-related costs exceeded the contribution generated by the products being sold.
The customer profitability curve therefore reflected the economics of the route to market as much as the economics of the customers themselves.
The board began modelling alternative distribution structures. One scenario reduced direct service from around 20,000 customers to approximately 7,500. The remaining 12,500 continued to be reached through local wholesalers, preserving broad market coverage while reducing the cost of the direct distribution network.
Customer service levels were also differentiated according to the importance of the relationship. Strategic customers continued to receive frequent replenishment, while smaller customers moved to a three-day service cycle. The distribution structure could then be designed around the economic value of the customer rather than providing the same service level to every outlet.
The model anticipated a temporary reduction in volume of around 7.2% during the transition. Materials fell with the lower volume while much of the production cost remained in place, allowing management to distinguish genuine savings from costs that would continue regardless of the sales reduction. The largest opportunities were concentrated in the supply chain and sales organisation.
Secondary transport provided another part of the solution. Delivery drivers operated fixed territories and knew the customers on their routes well. They were offered the opportunity to buy their vehicles and continue operating under supply contracts, while their role expanded to include sales and commission on the additional business they generated.
Some of these drivers gradually developed into mobile wholesalers. They carried stock, sold to smaller customers and used the relationships and local market knowledge developed through years of regular deliveries. The company retained broad market access while transferring vehicle ownership and part of the local distribution activity outside the corporate structure.
The combination of delivery and sales reduced the requirement for a large conventional sales force. Regional and local warehouse requirements also fell as the new distribution structure developed, allowing local warehousing to close while local wholesalers and the emerging mobile-wholesaler network continued serving smaller customers.
The transition took around nine months. The monthly loss of approximately US$1 million was eliminated and the company reached break-even, which had been the objective while the market was being developed.
During the following year, sales volumes returned to their previous level. The lower-cost route to market remained in place, and the business moved into profit.
From customer profitability to management action
These cases produced very different responses from the same underlying form of analysis.
The consumer-equipment manufacturer found that a small number of large customers consumed a disproportionate share of profit through weak product mix, logistics costs, export administration and slow payment. The clothing manufacturer improved customer economics through inventory changes, commercial renegotiation and more productive use of warehouse space. The wholesale and retail group showed how purchasing scale and shared infrastructure could make an apparently weak customer relationship valuable to the organisation as a whole. The beverage company discovered that the economics of serving the market were driving losses across almost the entire customer base and redesigned its route to market accordingly.
Customer profitability therefore provides management with a map of where profit accumulates and where it disappears. The next stage is understanding what causes each customer’s position on that map.
Some relationships can be improved through price, product mix, delivery frequency, order size, service levels, payment terms or commercial concessions. Others remain unattractive after those options have been exhausted and become candidates for customer rationalisation. Before ending the relationship, management also needs to understand the costs that will actually disappear, the costs that will remain, and the effects on purchasing scale, production capacity, distribution density and shared infrastructure.
The profit cliff provides visibility. Management judgement turns that information into a profitable decision.